
Dashboards in SAP C4C
Empower your business with cutting edge visual analysis using dynamic Dashboards in SAP Sales and Service Cloud.
In today’s fast-paced digital economy, real-time insights and data-driven decisions are critical for staying competitive. SAP Cloud for Customer (C4C) offers a robust and intuitive way to visualize business performance through dashboards—a key tool for both sales and service organizations.
This blog dives into what dashboards are in SAP C4C, why businesses need them, how they are created and assigned, and how SAPenova helps clients unlock their full potential through smart reporting.What Are Dashboards in SAP C4C?
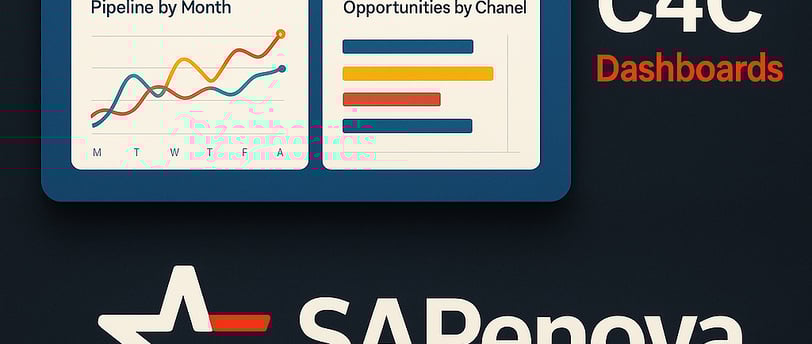
A dashboard in SAP C4C is a visual collection of reports, KPIs, and charts tailored to provide users with critical insights at a glance. Think of it as a control center that brings together all the relevant information a user needs to make informed decisions—whether it’s about sales pipeline movement, ticket resolution time, customer satisfaction, or marketing campaign performance.
These dashboards can include:
• Pie charts
• Column and bar charts
• Tables
• Numeric KPIs
• Trend lines
Why Do Businesses Need Dashboards?
Dashboards are essential because they:
• Improve visibility into operational performance
• Accelerate decision-making with real-time data
• Highlight exceptions and issues before they escalate
• Motivate teams by showing progress toward KPIs
• Align teams with strategic goals
For example, a Sales Manager can track team performance, forecast trends, and follow lead conversion rates directly from the home dashboard.
Business Role-Based Assignment: Personalized Insight for Every Role
SAP C4C allows dashboards to be assigned to specific business roles, ensuring each user sees only the data that’s relevant to their function. This avoids information overload and boosts focus.
For instance:
• A Service Agent might see dashboards on ticket resolution time, customer satisfaction score, and open tickets by priority.
• A Sales Executive may see sales pipeline stages, monthly revenue targets, and lead aging reports.
This role-based access ensures security, clarity, and productivity.
How to Create a Dashboard in SAP C4C
Creating a dashboard is a straightforward process:
1. Go to “Analysis” Work Center > Dashboards
2. Click on “New”
3. Provide a name, description, and choose layout (e.g., 2-column, 3-column)
4. Add tiles by selecting from available reports or KPIs
5. Customize the tile sizes, colors, and layout
6. Save and preview the dashboard
Optional: Group tiles logically—for example, keep pipeline charts on the left and KPIs on the right.
How to Assign Dashboards to Business Roles
Once your dashboard is ready, follow these steps to assign it:
1. Go to the Administrator work center
2. Choose General Settings > Business Roles
3. Select the role (e.g., Service Agent, Sales Manager)
4. Navigate to Access Restrictions > Work Center Views
5. Add the Analysis work center with required read/edit permissions
6. Assign the dashboard by setting it as the default view under Home Page Adaptation
You can also use the Page Layouts and Navigation Adaptation to fine-tune how dashboards appear for each role.
The Real Advantage: Dashboards with Useful Reports in C4C
SAP C4C dashboards are only as effective as the reports behind them. That’s why combining them with custom or standard reports tailored to business KPIs is critical. You can:
• Use standard reports like “Open Tickets by Priority” or “Opportunities by Sales Stage”
• Create custom reports combining multiple data sources
• Enable drill-downs for deeper investigation
• Export insights in Excel/PDF for team reviews
Dashboards not only display static metrics but also offer interactive tools for actionable insights.
How SAPenova Helps You Optimize Reporting in SAP C4C ?
At SAPenova, we specialize in optimizing the reporting framework in SAP C4C. Our expert consultants help clients:
• Define the right KPIs for their business model
• Build intelligent dashboards for each business role
• Create custom reports from multiple data sources
Automate distribution of reports via email scheduling
• Enable real-time visibility across sales and service teams
Whether you’re in manufacturing, B2B services, retail, or high-tech—our dashboard and KPI solutions bring clarity to your customer engagement strategy.
Ready to transform your data into decisions?
Connect with our SAP CX Champs at SAPenova to build dashboards that move your business forward.